|
|
Difference visibility graph algorithms
Difference visibility graph is an efficent tool for time series analysis, espeically for Sleep EDF file.
Reference
Features
- Robustness agaist noise
- Read EDF File directly
- Detect the disconnected telemetry or electrode lossing
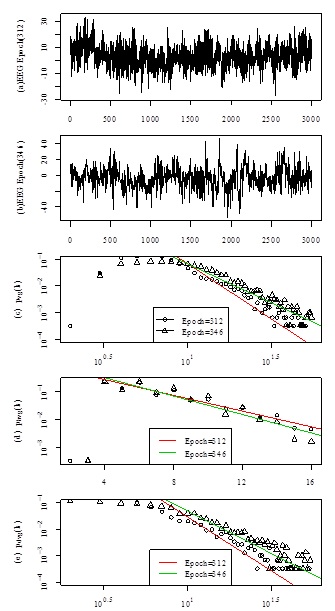
- Extract the mean degree of DVG and degree distribution of DVG
- Classify the sleep stages
- An example fo degree distribution for sleep stages
Usage
for example, if your path is c:\ then
Execute the command to extract features by DVGs
Sleep_DVG -i sc4002e0.edf -i sc4012e0.edf -i sc4102e0.edf -i sc4112e0.edf -i st7022j0.edf -i st7052j0.edf -i st7121j0.edf -i st7132j0.edf -t 1 > 8subject_train_pz.txt
Sleep_DVG -i sc4002e0.edf -i sc4012e0.edf -i sc4102e0.edf -i sc4112e0.edf -i st7022j0.edf -i st7052j0.edf -i st7121j0.edf -i st7132j0.edf -t 2 > 8subject_test_pz.txt
where 8subject_train_pz.txt and 8subject_test_pz.txt are traning file and testing file
2. Do the classfication with R
- Execute the R and run the code in the R files.
- For example, to get the sleep-wake sleep stage classfication (TableVI in the paper), execute the R "awa_sleep_Table VI.r"
A GUI tool for Sleep EDF file was devoloped based on Windows MFC,
which is read the 2nd channel of EDF file.
You can download from here.
If you have some problems on the downloaded file, please contact email: Guohun dot Zhu at usq dot edu do au
|
|